By The Numbers: Thru 2021-08-24
August 24, 2021
During my road trips, I like to write “by the numbers” themed posts where I share a little bit about how the data shaping up during the trip. Here’s the first update for the 2021 Epic Road Trip!
Data Capture
My AWS Lambda continues to pull Tesla data and put the results in an Amazon Kinesis Data Stream. The stream is then saved to Amazon S3 and can be queried via Amazon Athena.
So far, the lambda is polling for data three times a minute, runs on average for 1.1 seconds, and is succeeding about 99.7% of the time. The cause of the errors is lambda timeouts: I set a max execution time of 20 seconds and there are instances where the Tesla API does not respond fast enough. Such is life when working with RESTful APIs.
About 26k observations have been put into the data stream so far with each of them describing the state of my car when it was pinged: GPS coordinates, heading, speed, temperature, charge status, etc… There are more than 160 attributes recorded in each observation so there is plenty of data to play with.
Queries are happening super quick: less than 2 seconds scanning single digit MBs each time. I am taking advantage of compression and partitioning to help optimize querying.
Observations
Using Tableau, here is a look at the route traveled so far:
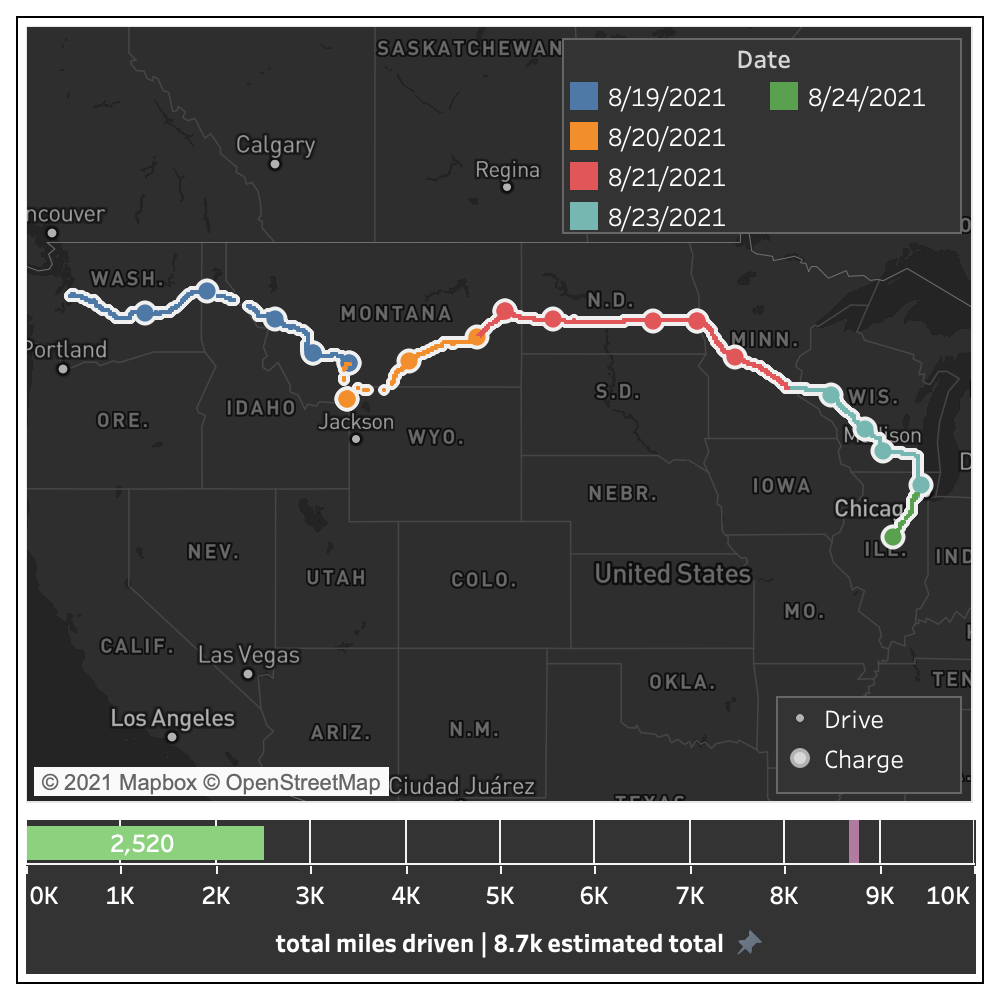
It has been a fun ride so far: Yellowstone and Beartooth Highway was a blast. I captured a time-lapse of the latter:
I added “charges” to the map because I am noticing I am stopping a lot more often then my previous road trips. There are a ton of faster Tesla Superchargers now - so the stops feel pretty quick. I think I am going to do some analysis to compare drive time vs charge time and see if there is a meaningful difference between this trip and previous trips.